Using the Monitoring application
The BlueMind monitoring tool allows you to monitor all server data in real time, as well as view historical data thanks to its database storage.
The supervision tool is installed by default in BlueMind and must not be uninstalled.
The BlueMind monitoring tool brings together the following products:
- Grafana: a web-based data visualisation and monitoring application
- Alloy: a tool for data collection and reporting
- Mimir: a specialised database for metrics, events and their real-time analysis (Prometheus)
ℹ️ For further information, please refer to the tool’s documentation on Grafana Learn
BlueMind’s packaging of these products automatically generates alerts and dashboards.
Accessing the monitoring tool
The monitoring tool is automatically installed and configured in BlueMind.
Access to the application is role-based:
- “Monitoring Administration”: full access to the monitoring tool
- “Monitoring console”: read-only access to the monitoring tool
The ‘admin0’ user has full access by default.
Monitoring is carried out for the entire installation and not on a per-domain basis. Therefore, if you grant access to a domain administrator, they will have visibility over all the installation’s data.
Users who have been assigned one of these roles will then see (they may need to log in again) a ‘Supervision’ link in the header bar, allowing them to access the console:
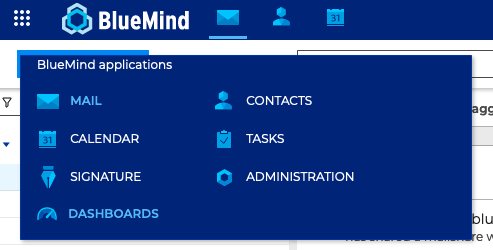
The monitoring tool can also be accessed directly by visiting the URL https://<votre bluemind>.tld/grafana/.
The credentials required are those of the installation wizard (Setup Wizard) provided during the installation of BlueMind (step 4 of the Post-installation Configuration).
View the dashboards
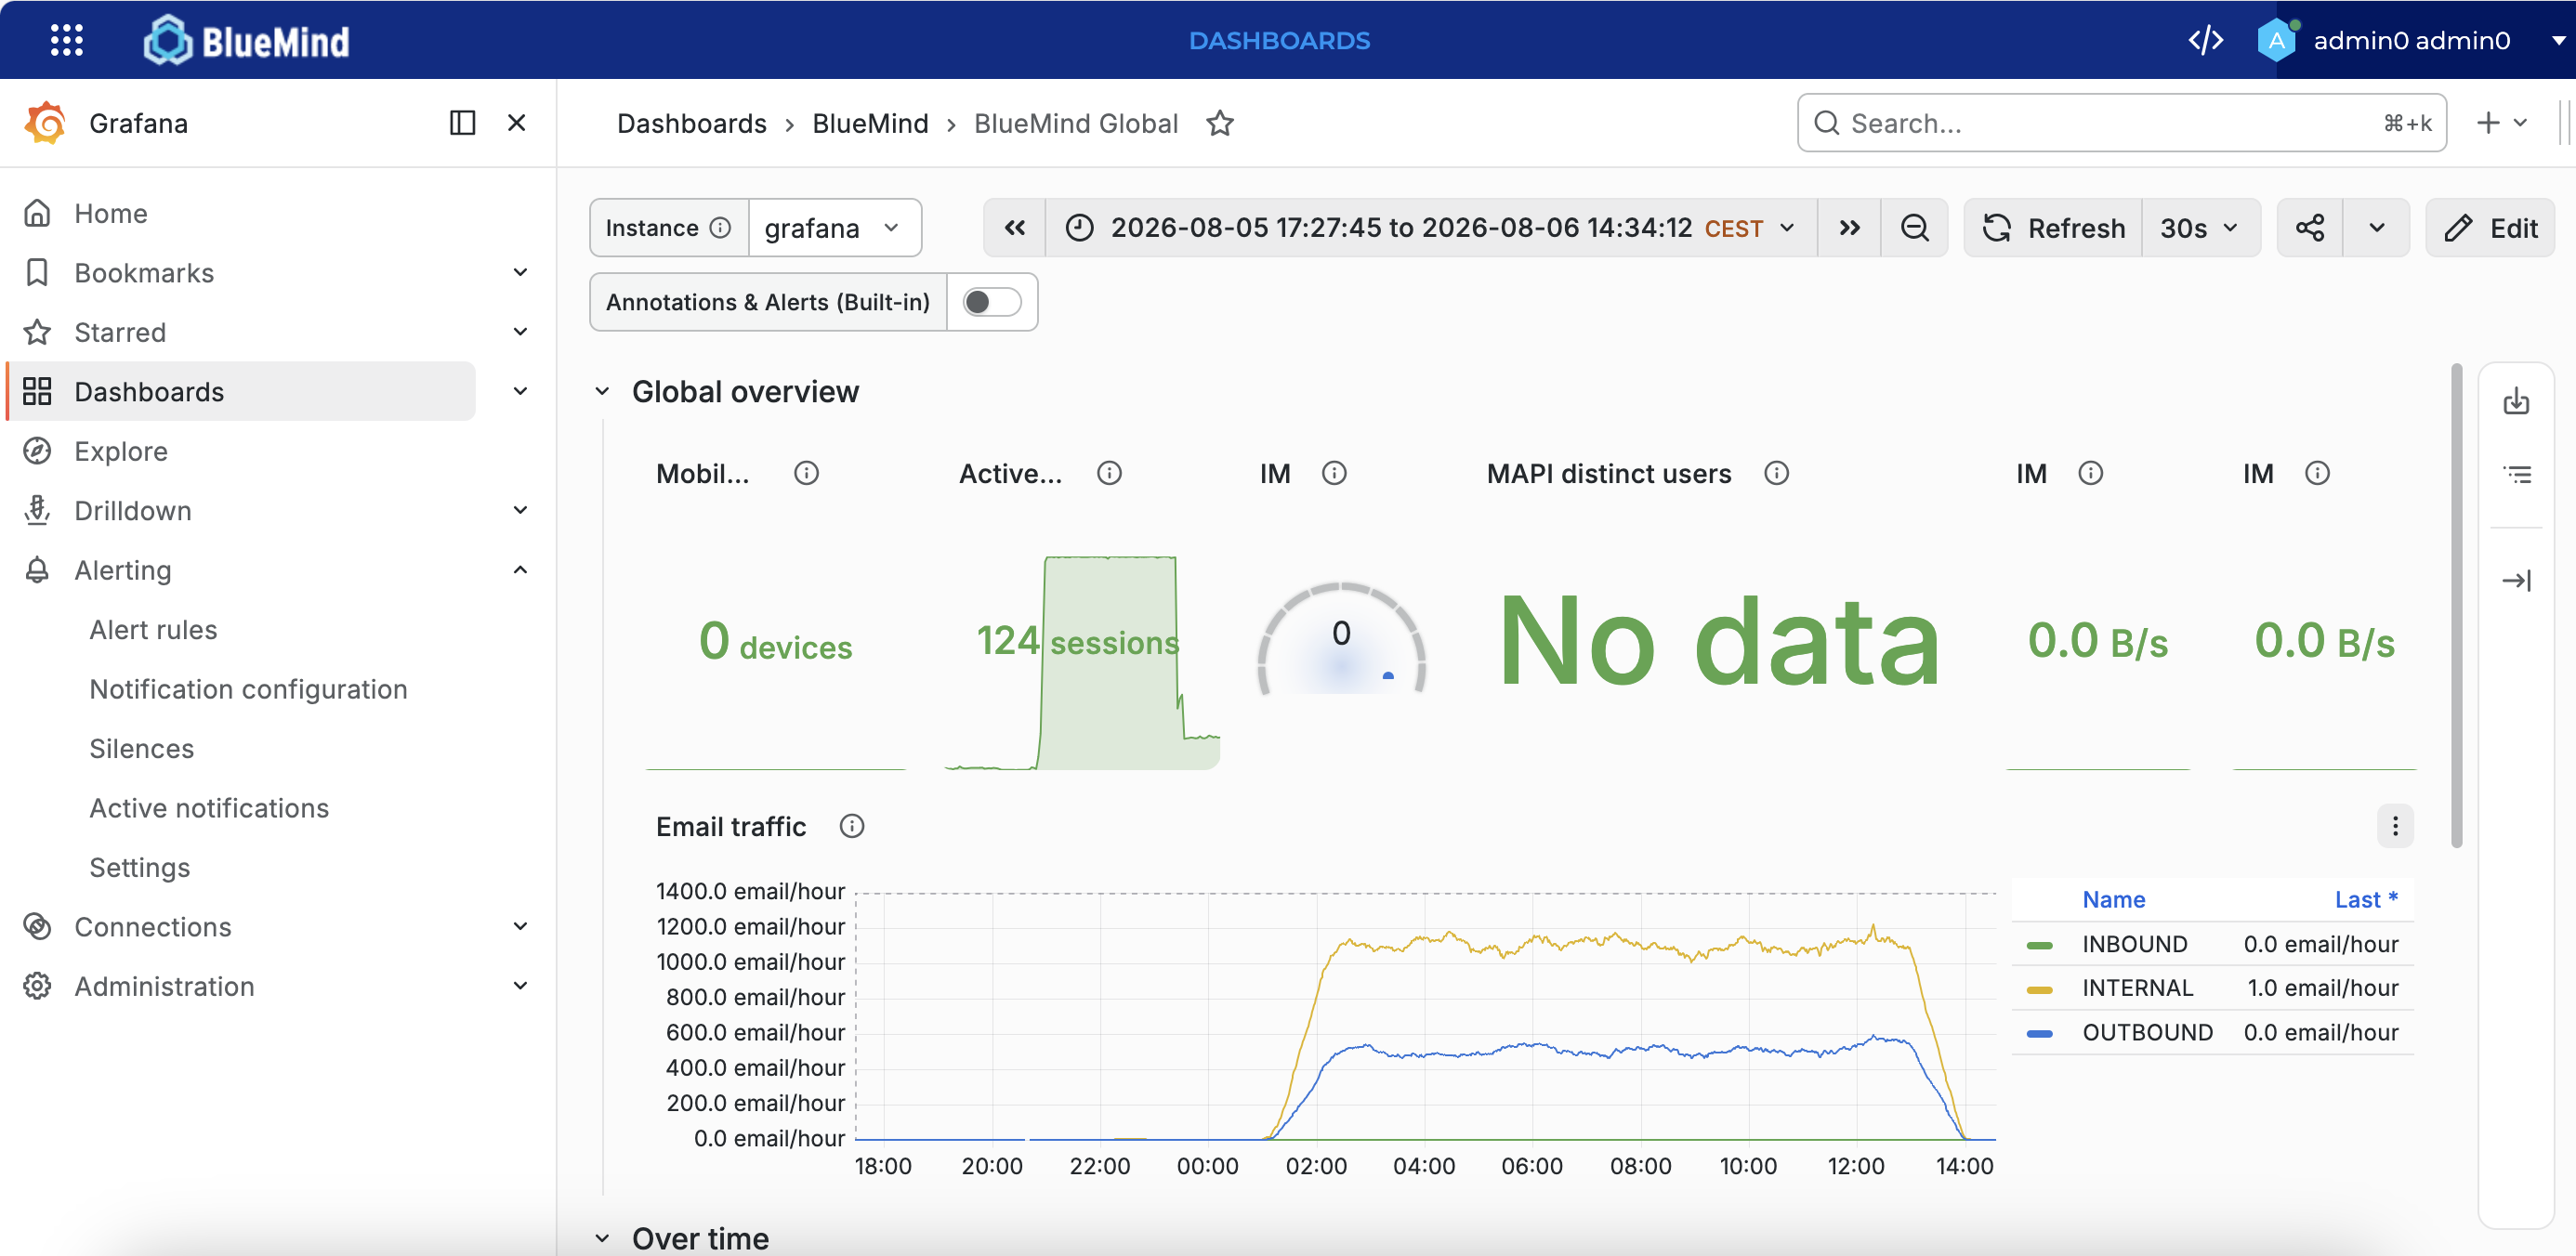
The Monitoring application opens directly to the “Global overview” dashboard, which provides an overview of data relating to mail usage:
- the number of mobile, web, IMAP and MAPI sessions
- incoming and outgoing email traffic
- Real-time sessions
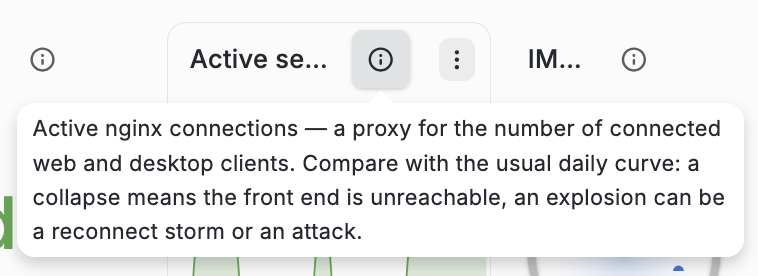
Each graph or metric is explained. Click the  icon for more information on the analysed data and the result displayed.
A number of dashboards have been configured and are ready to view. To see the list of available dashboards, go to the ‘Dashboard’ tab.
Dashboards tagged ‘BlueMind’ must not be modified. As these are managed directly by BlueMind, any changes to the settings will be overwritten each time the system is updated.
Some of the most important dashboards include:
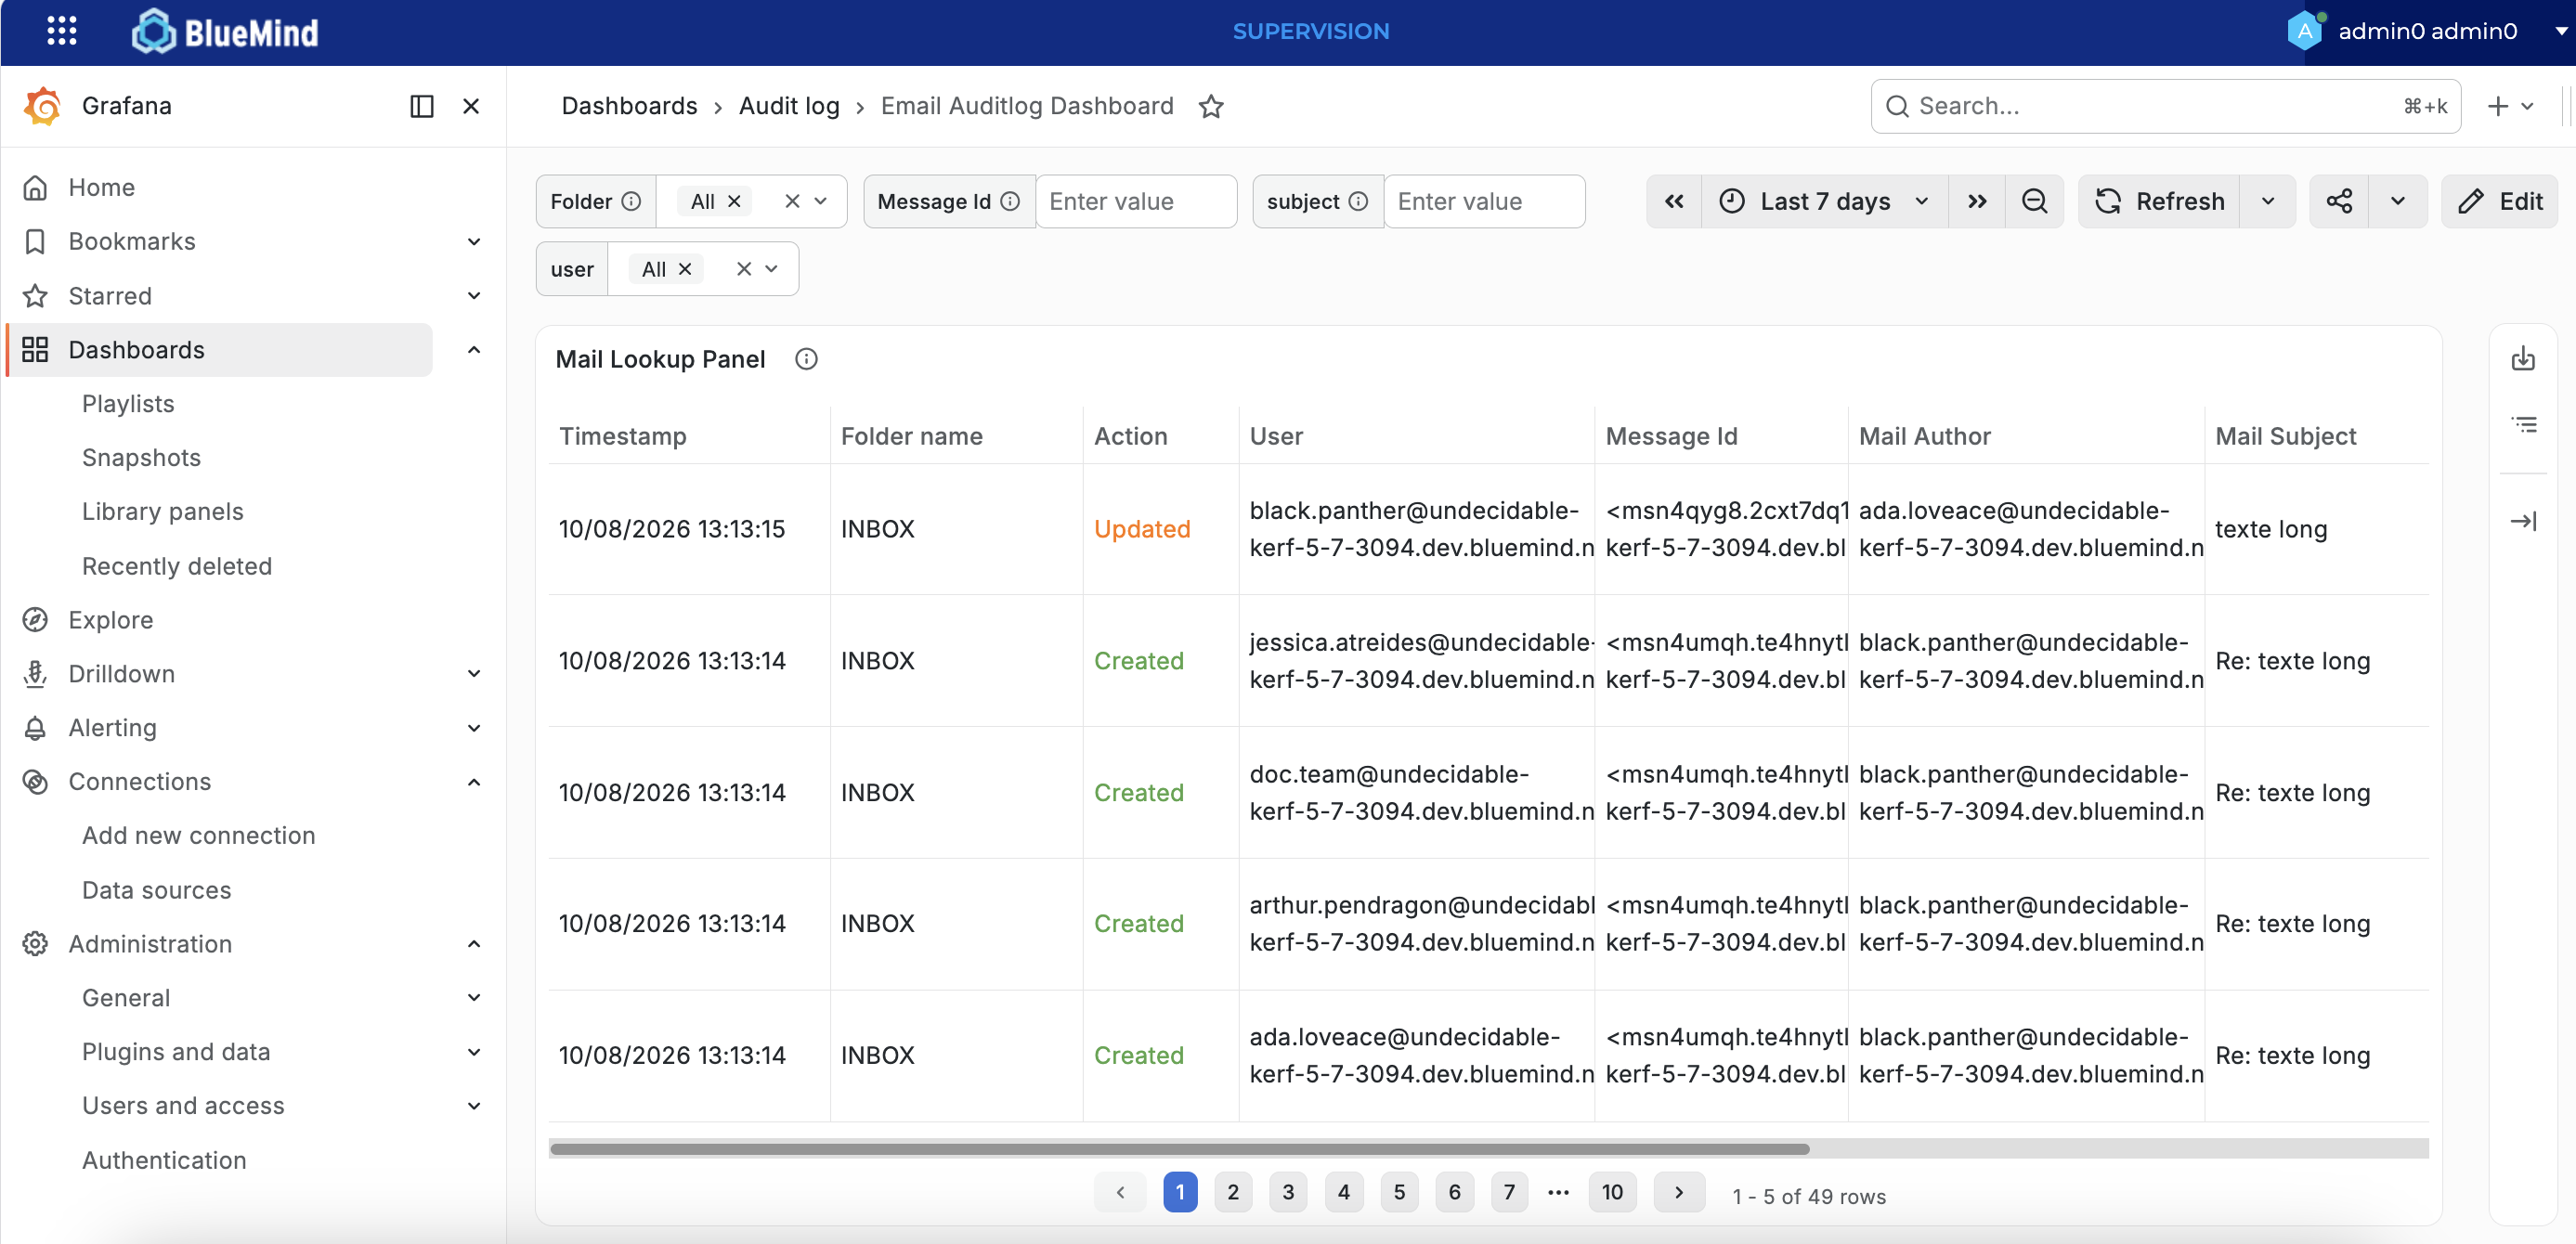
- The Auditlog dashboards provide information on connections, emails, events, etc. (
For further information see the page Analyzing logs with Auditlog)
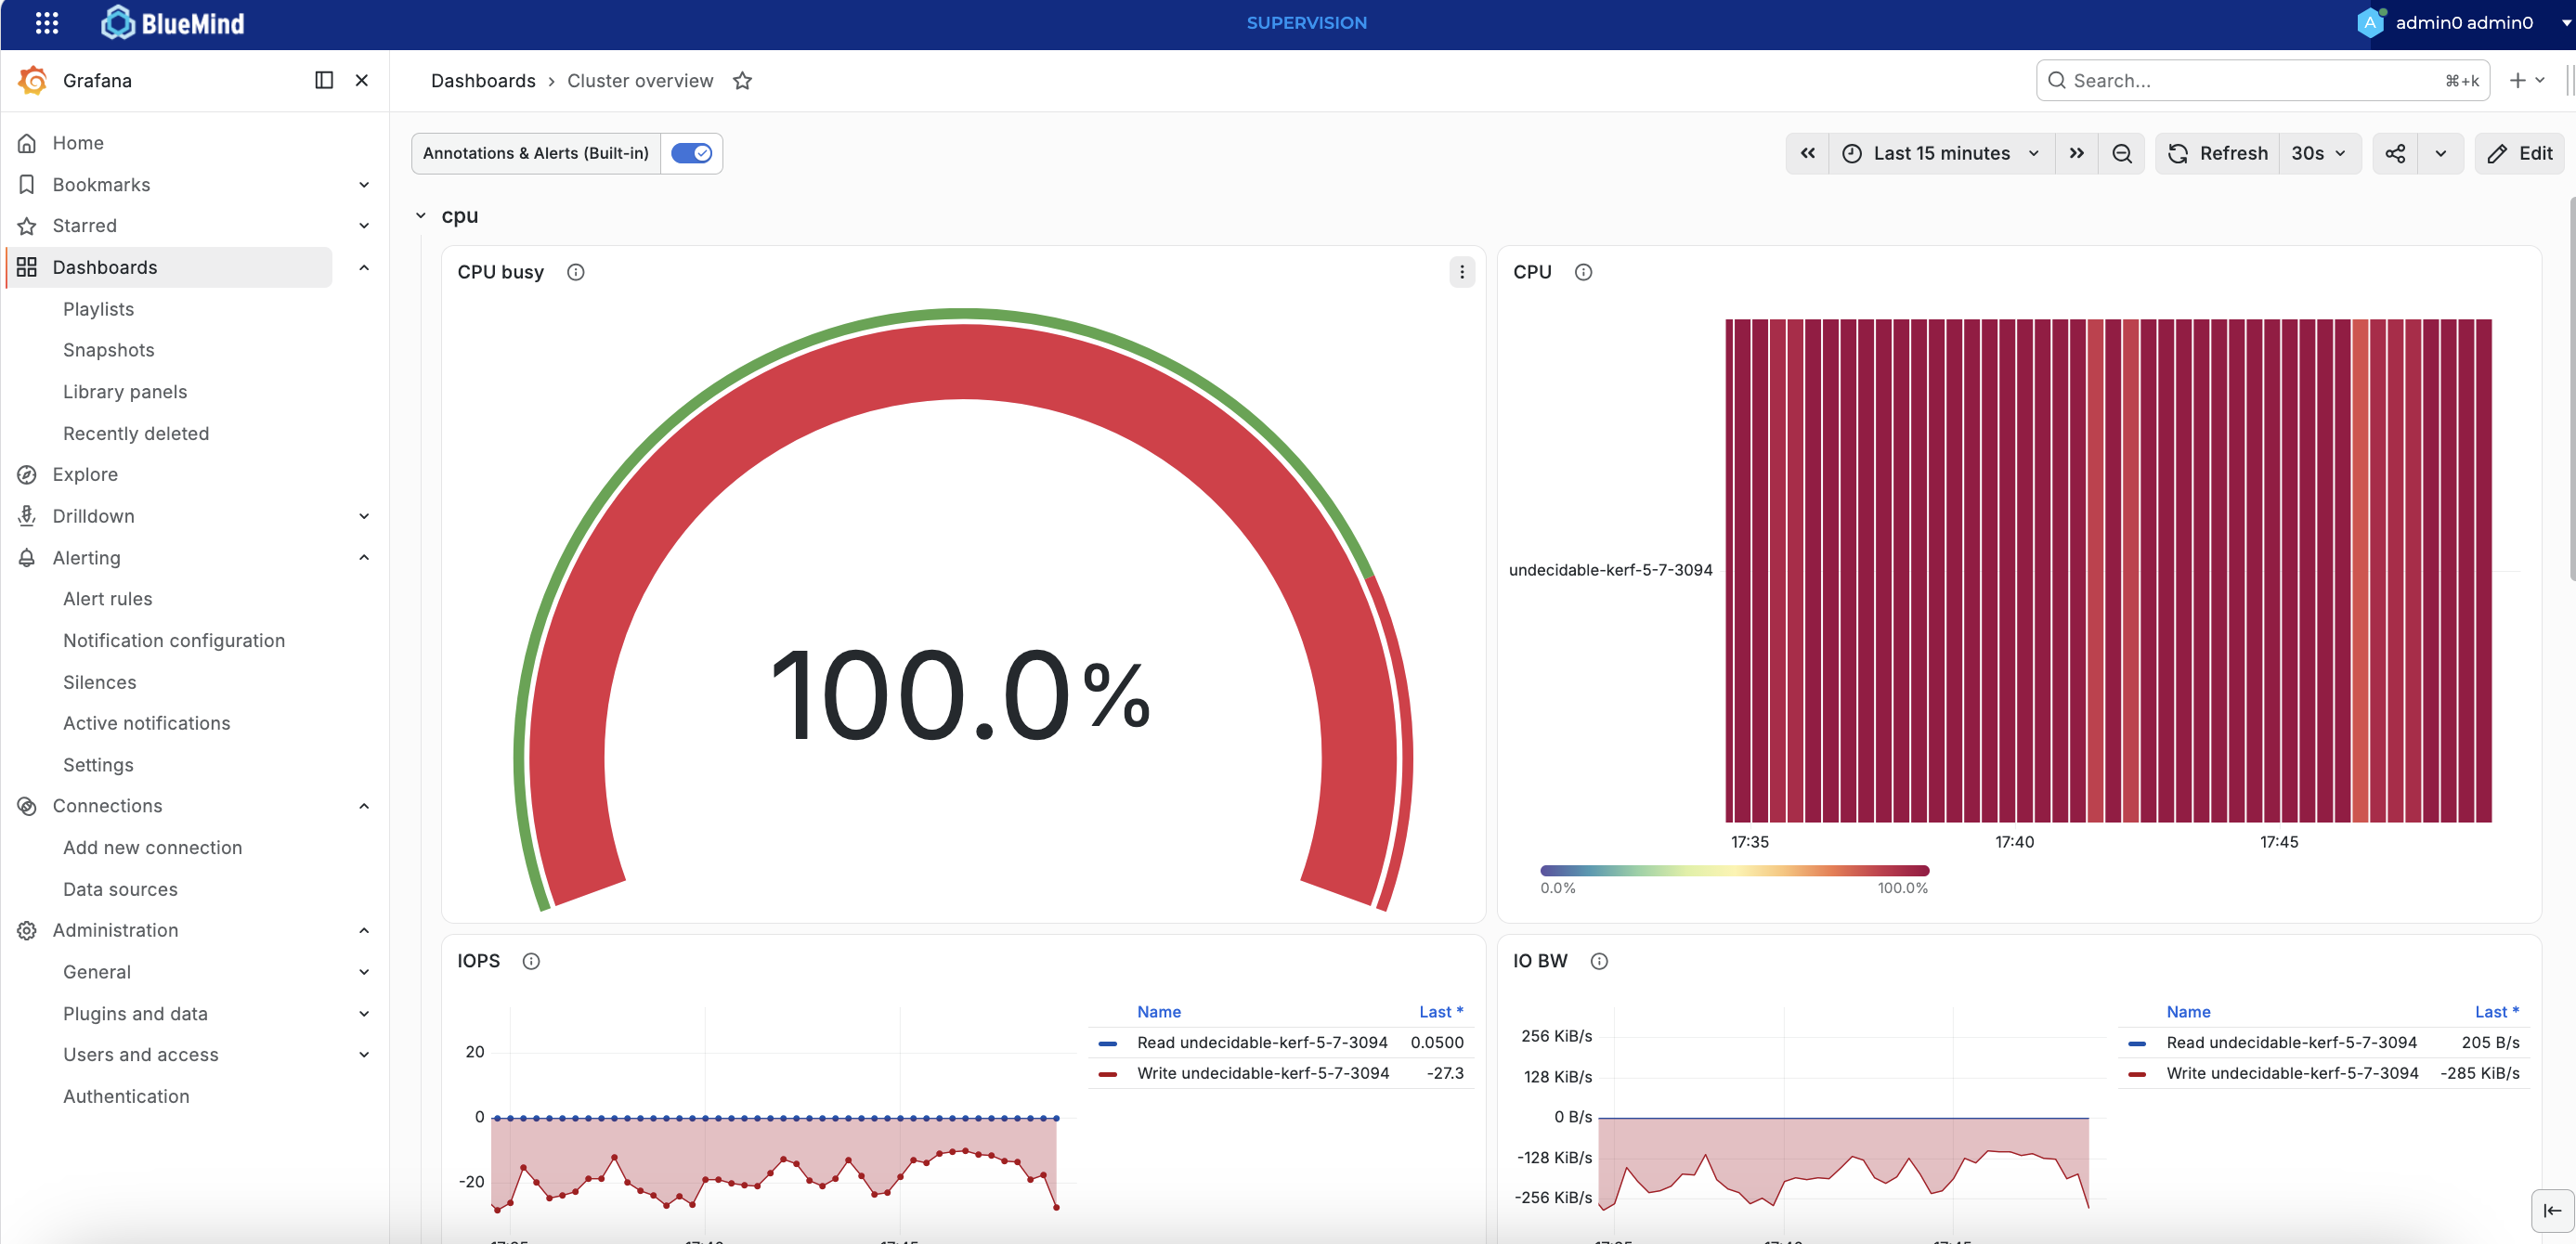
- The Cluster Overview dashboard, which allows you to view and analyse server metrics (CPU, IOPS, etc.)
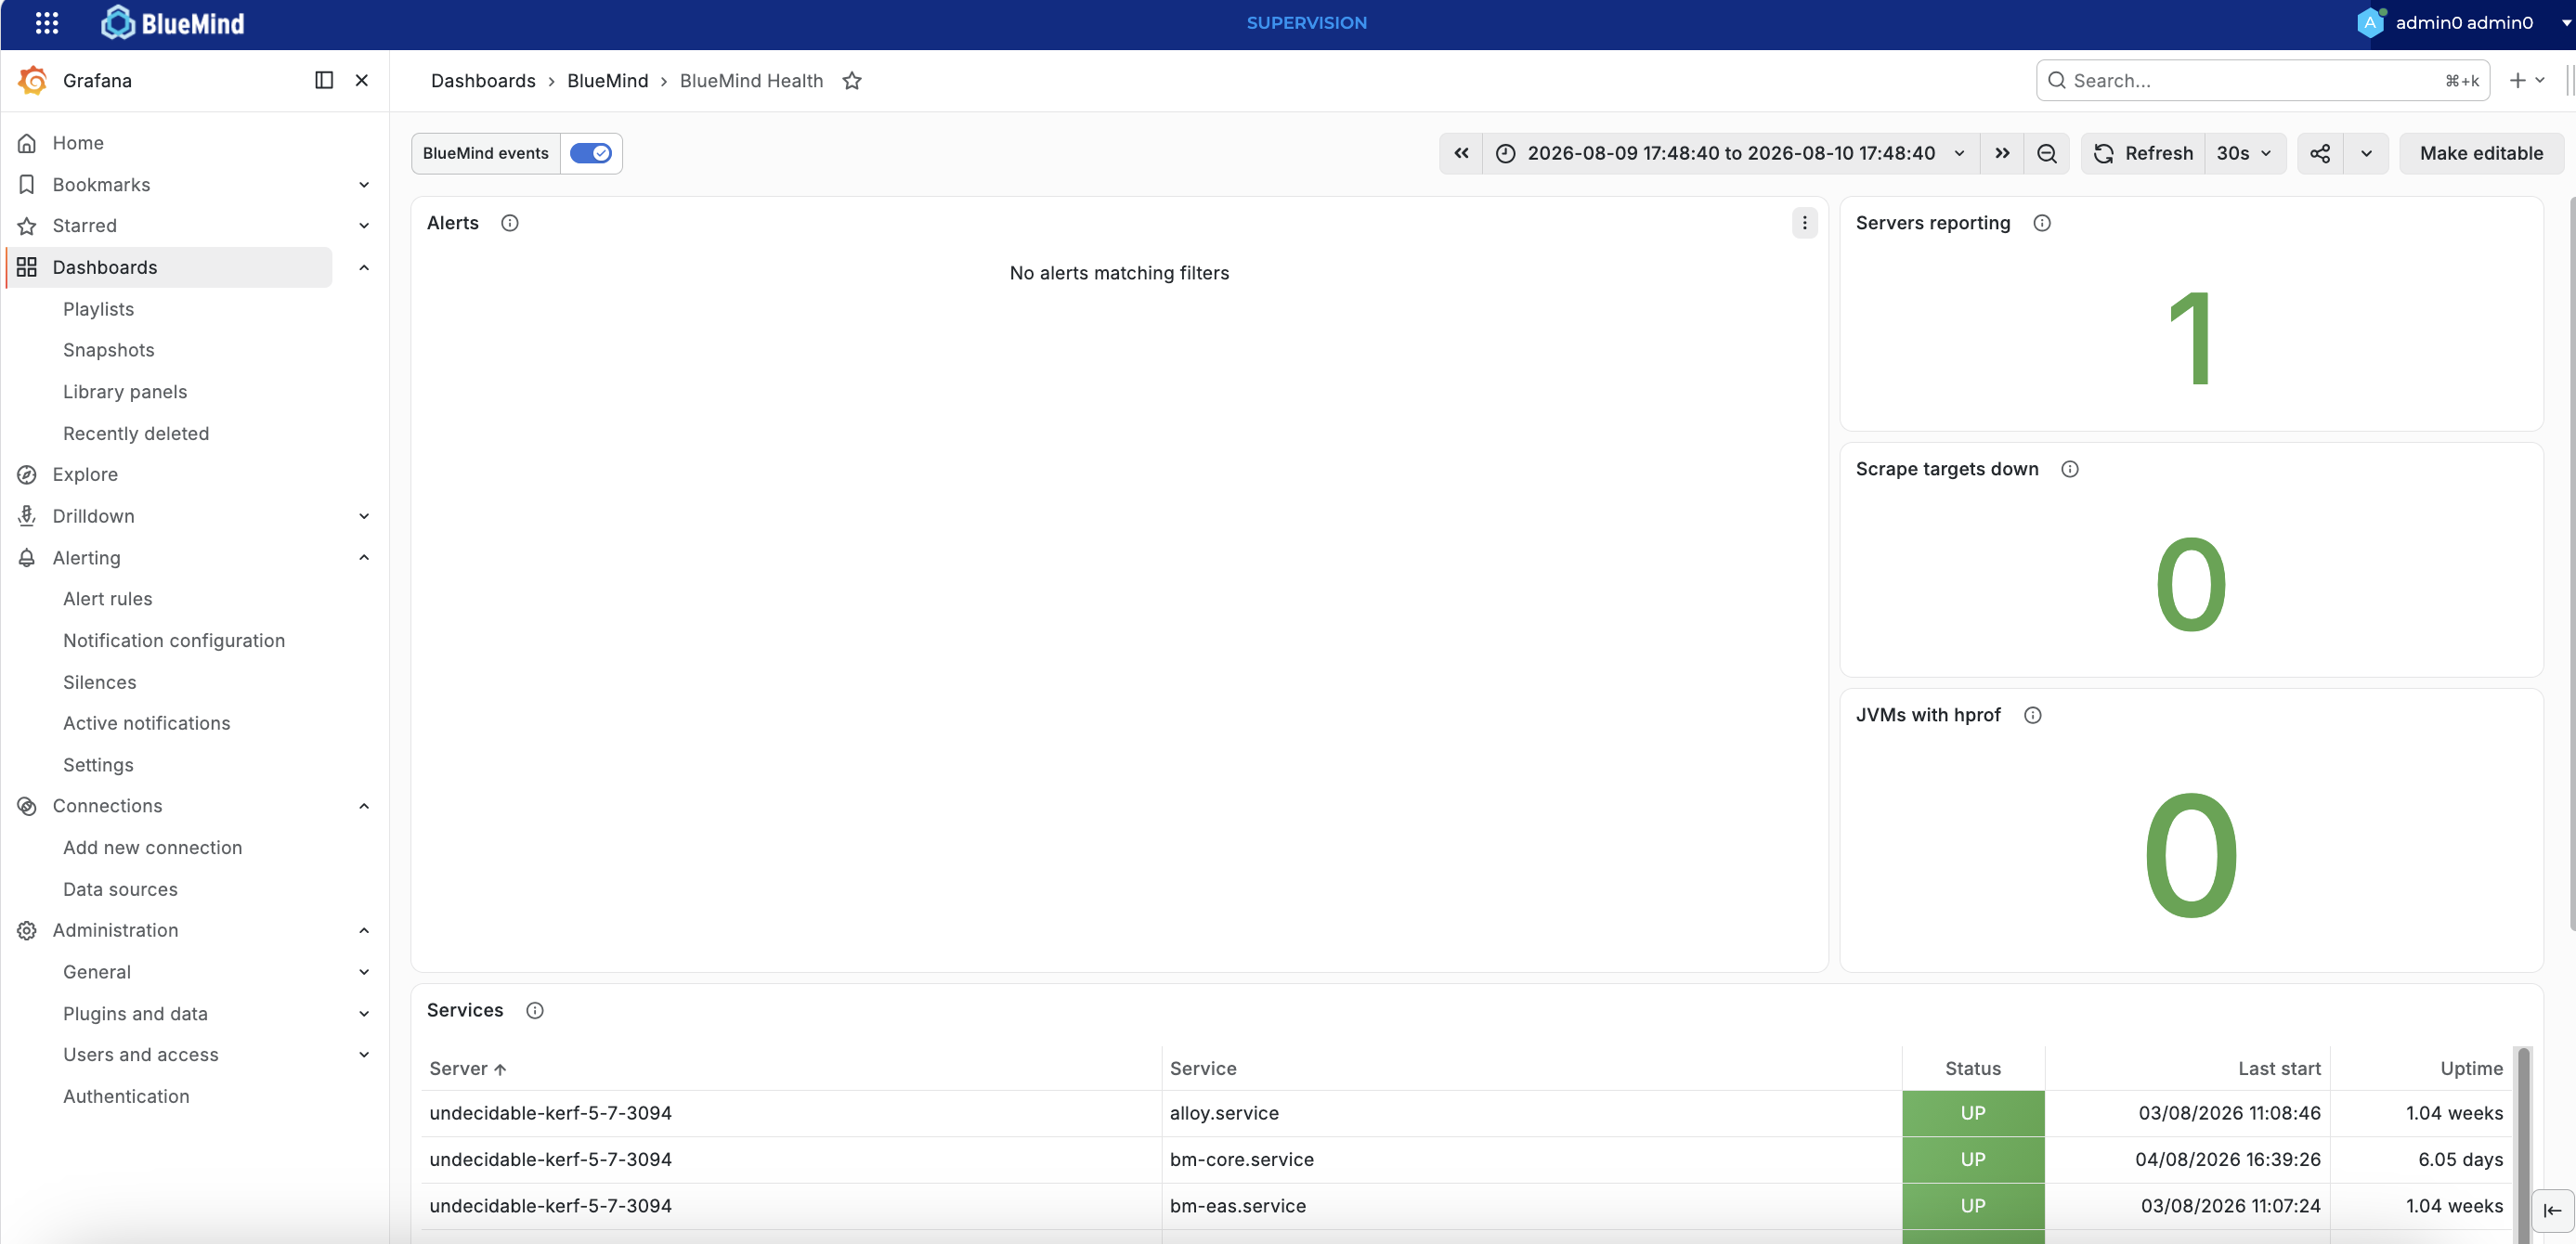
- The BlueMind Health dashboard, which allows you to view alerts, amongst other things
At the top of each dashboard is an action bar which allows you, amongst other things, to:
- Enable/disable the Annotations & Alerts option, which displays important actions (such as a service restart) on the dashboard charts
- Change the analysis period to be displayed
- Customise the dashboards by clicking on
Edit

View additional information
As well as the dashboards, you can view:
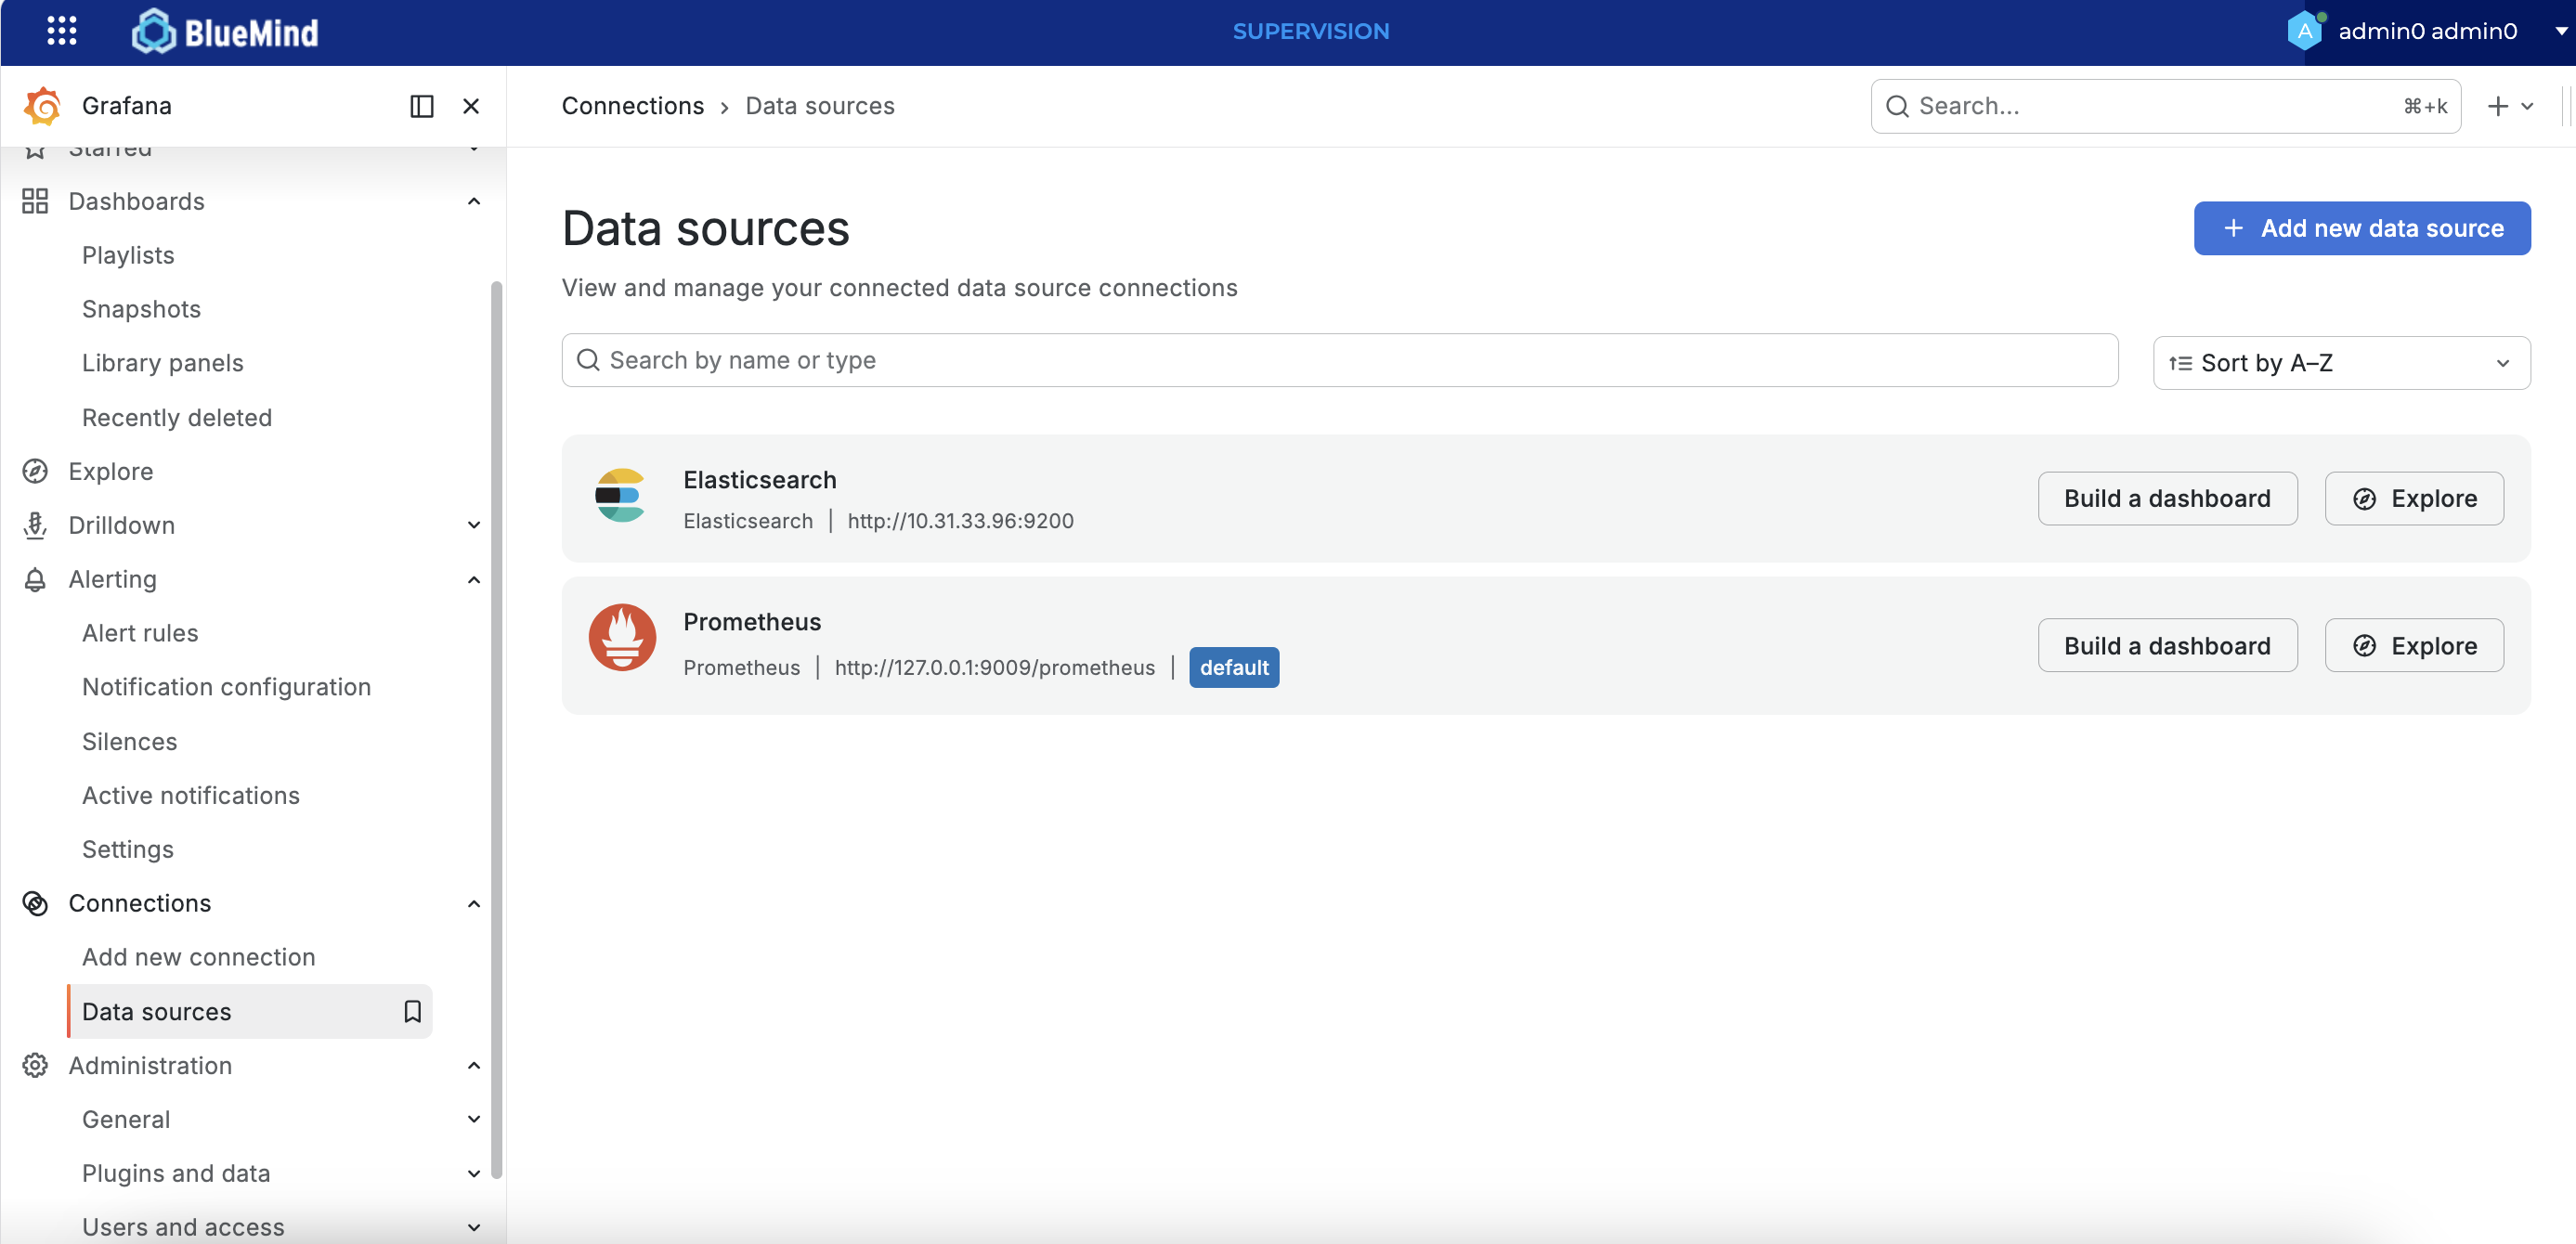
- Source data from Elasticsearch (log database, access to Auditlogs via the Auditlog dashboard) and Prometheus (historical metrics visualised by Grafana) by going to the Connections > Data source tab
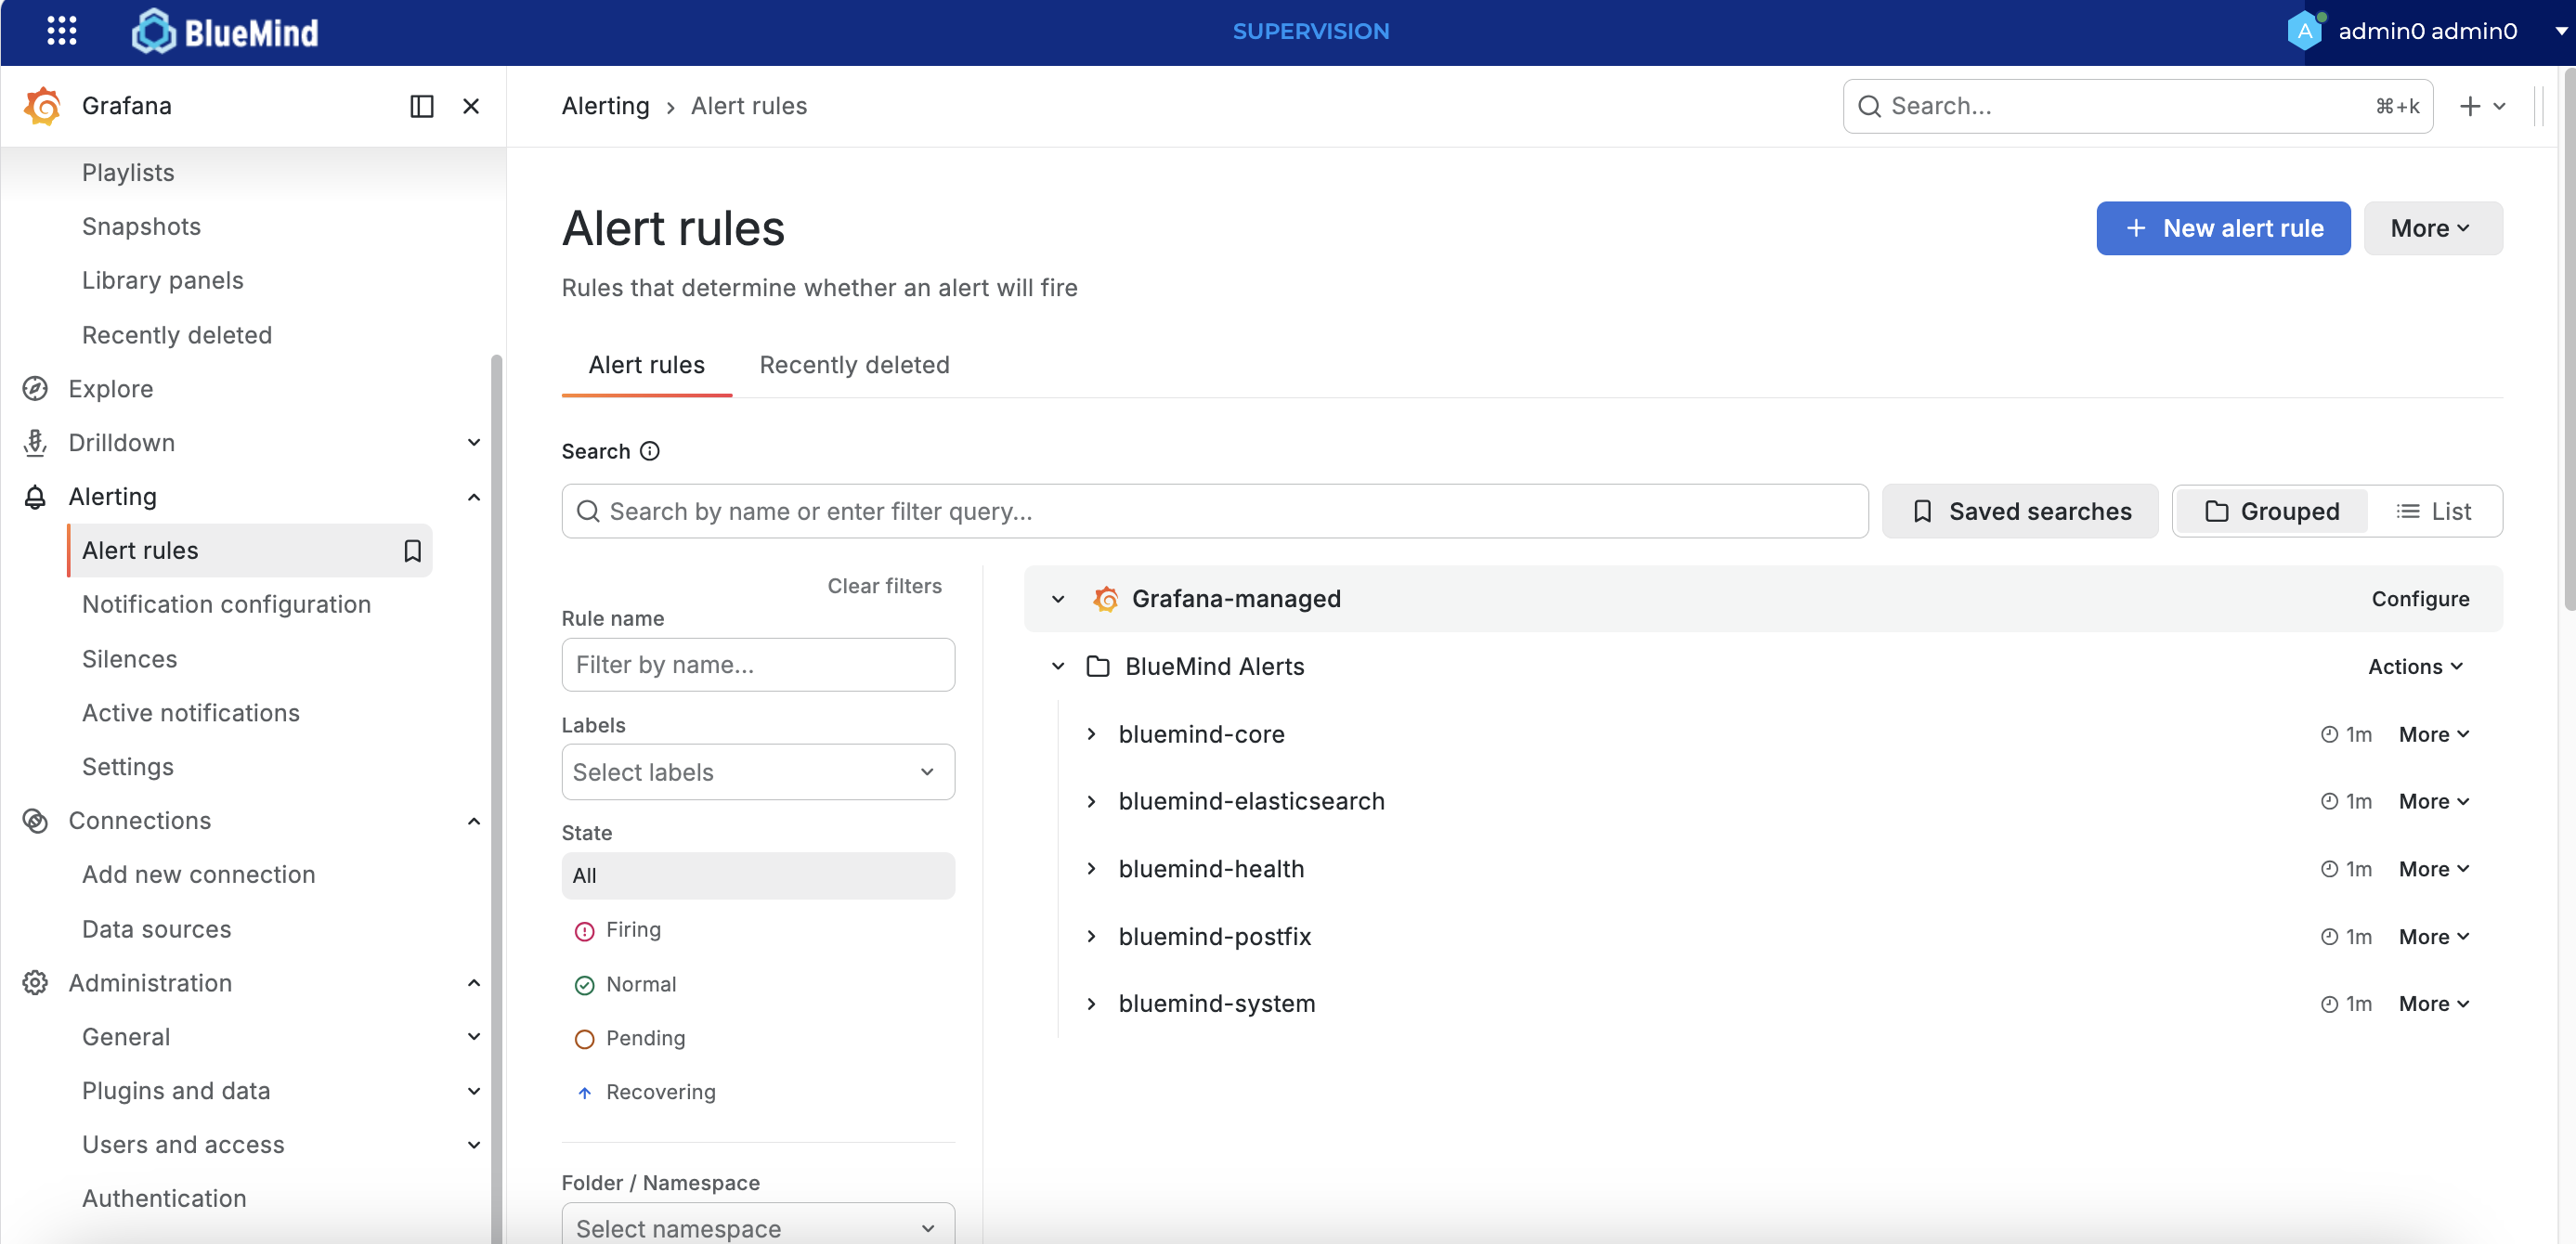
- Configure alerts by going to the Alerting > Alert Rules tab
Explore the data
The ‘Explore’ tab allows you to browse the data in the database – in other words, the history of the metrics collected.
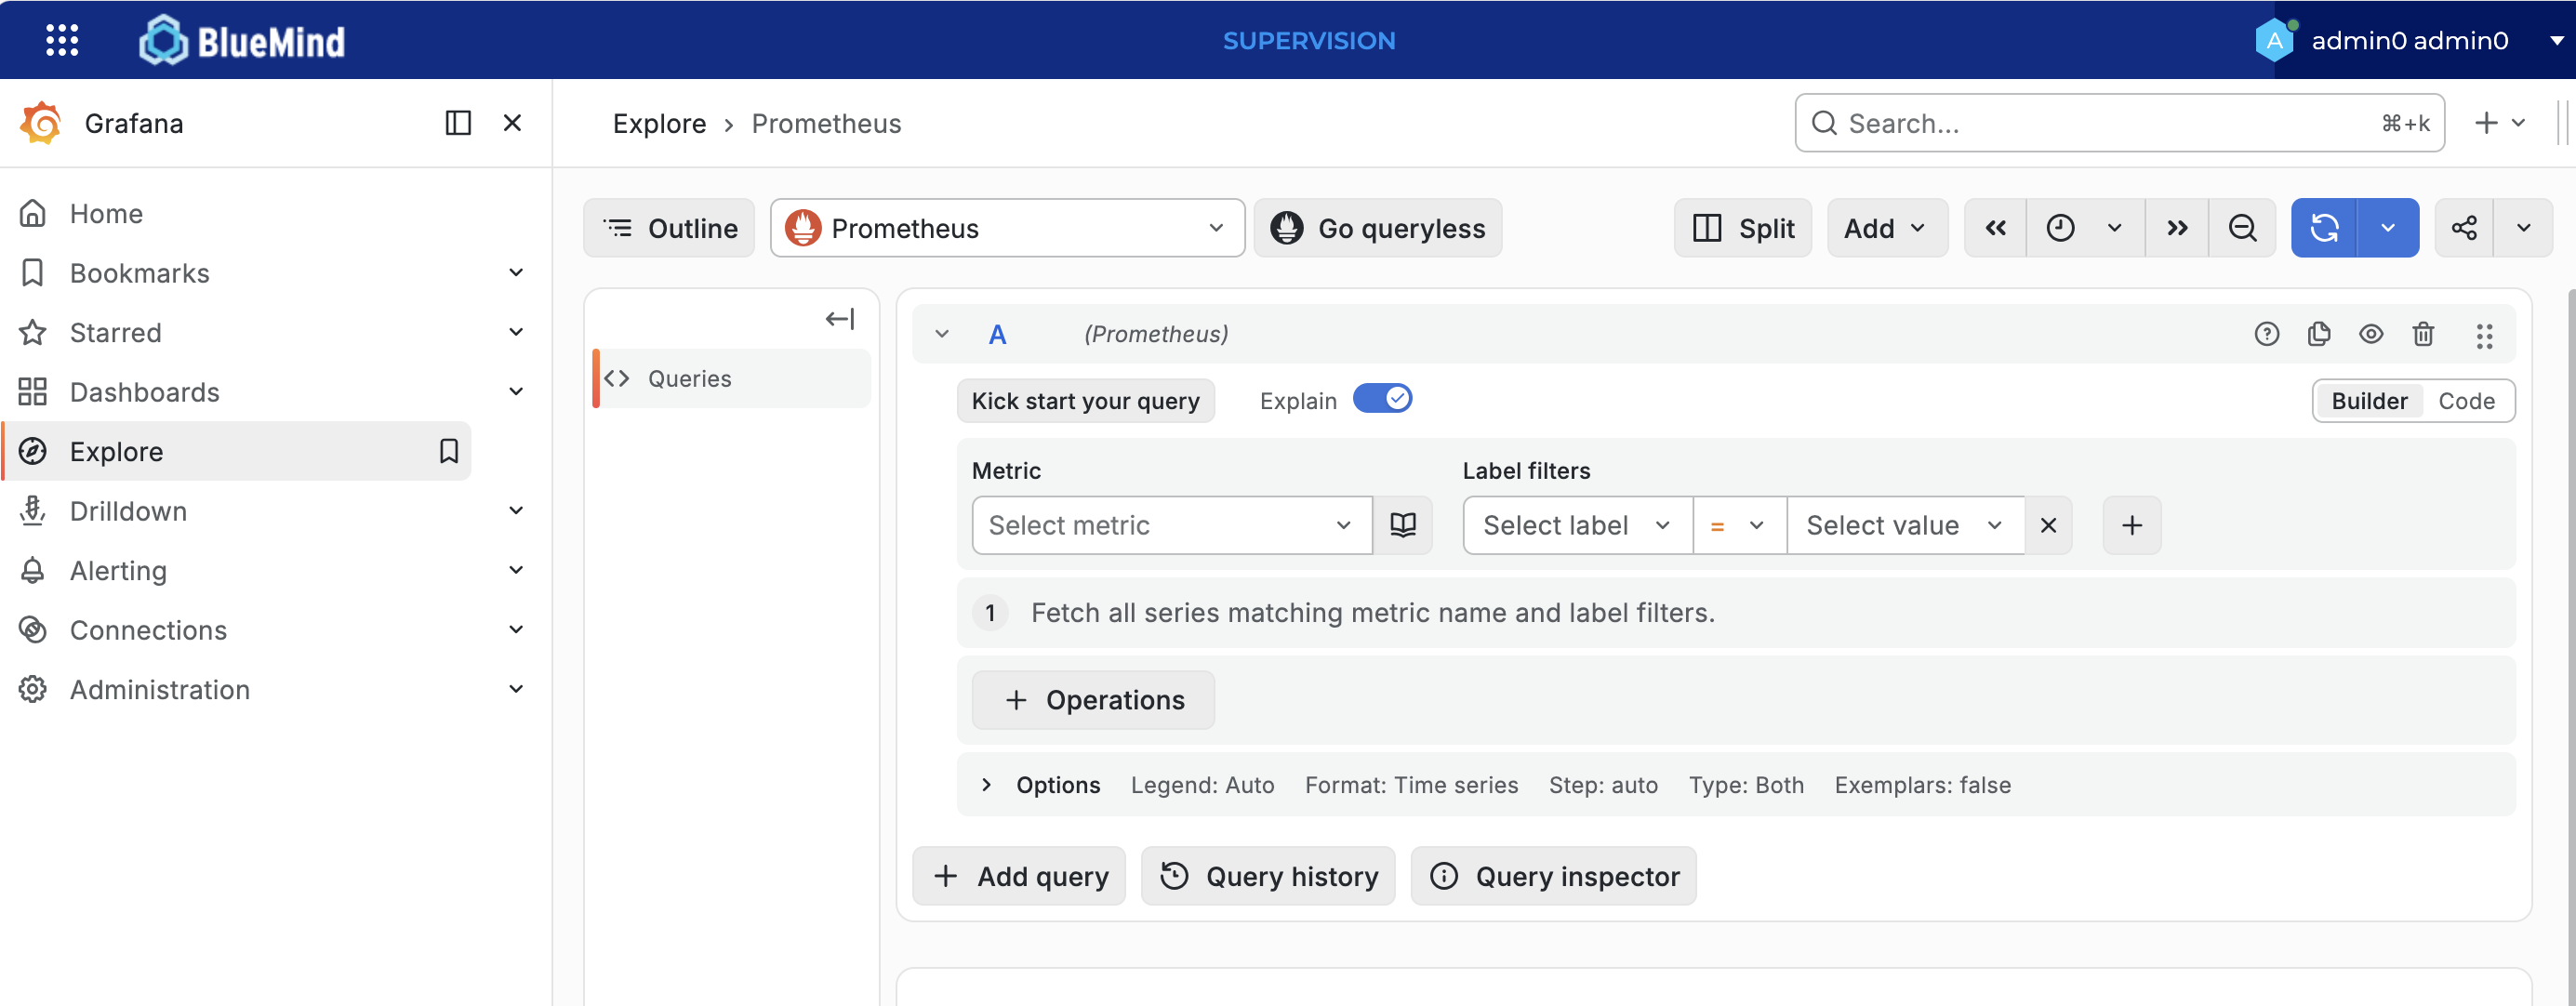
To explore the data:
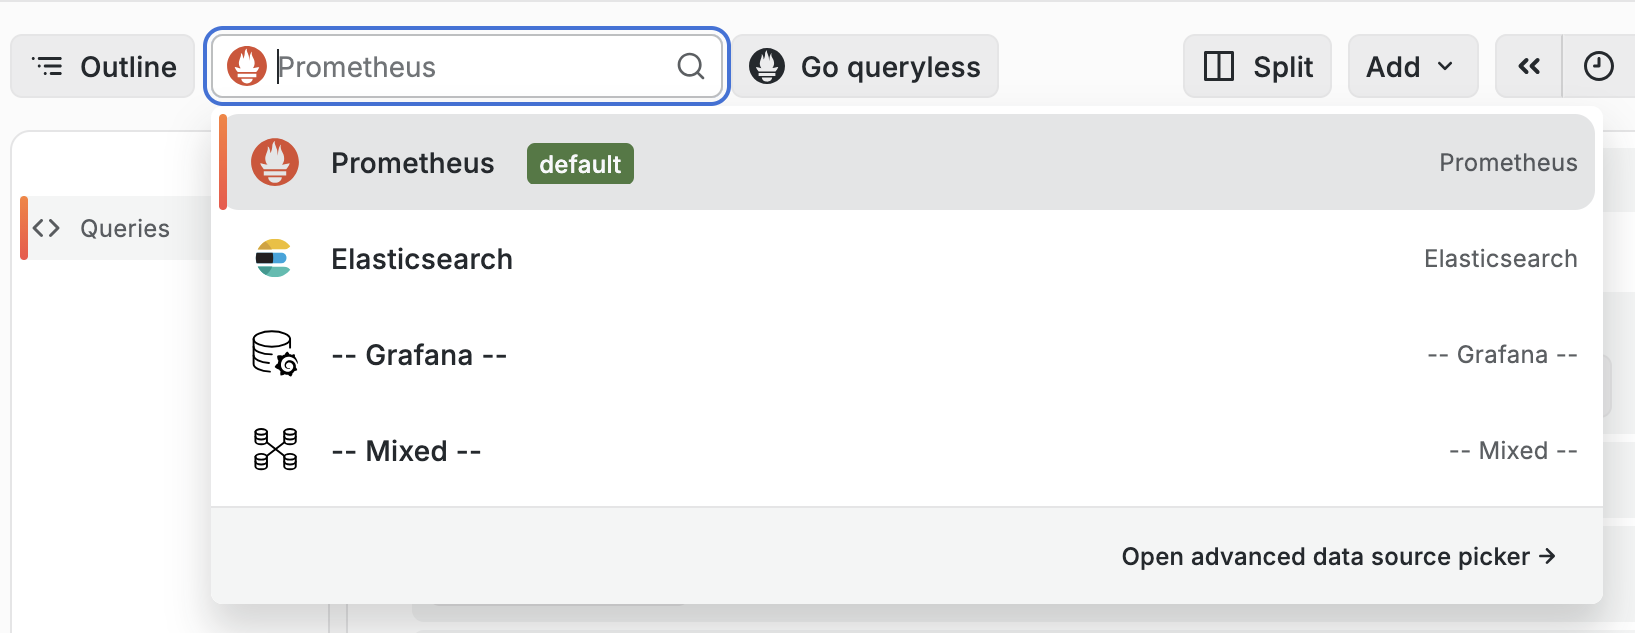
-
Select the data source
-
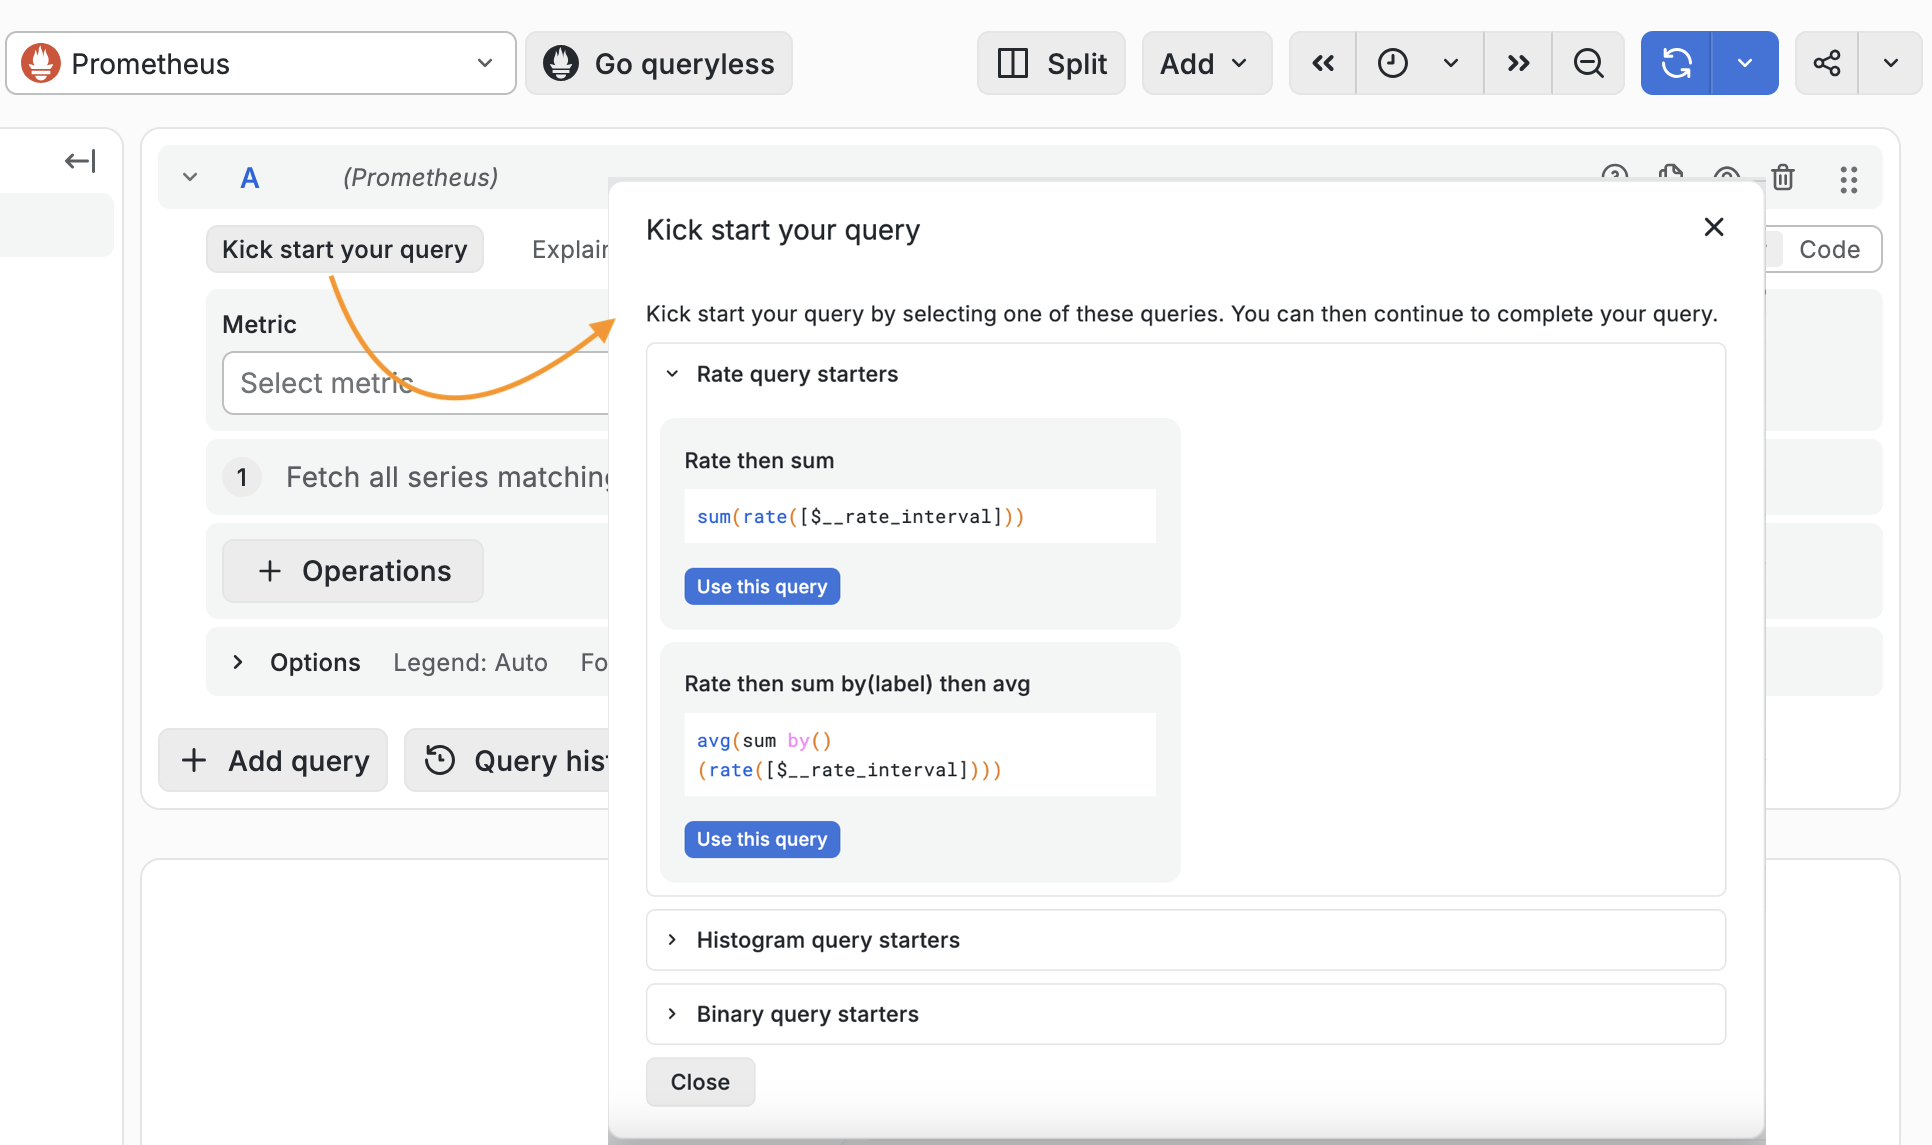
Configure your query according to the data to be analysed
💡 Kick-start your query
Use pre-programmed queries to make analysing Prometheus data easier
Managing alerts
Alerts can be viewed in the administration console > Monitoring console > General system status:
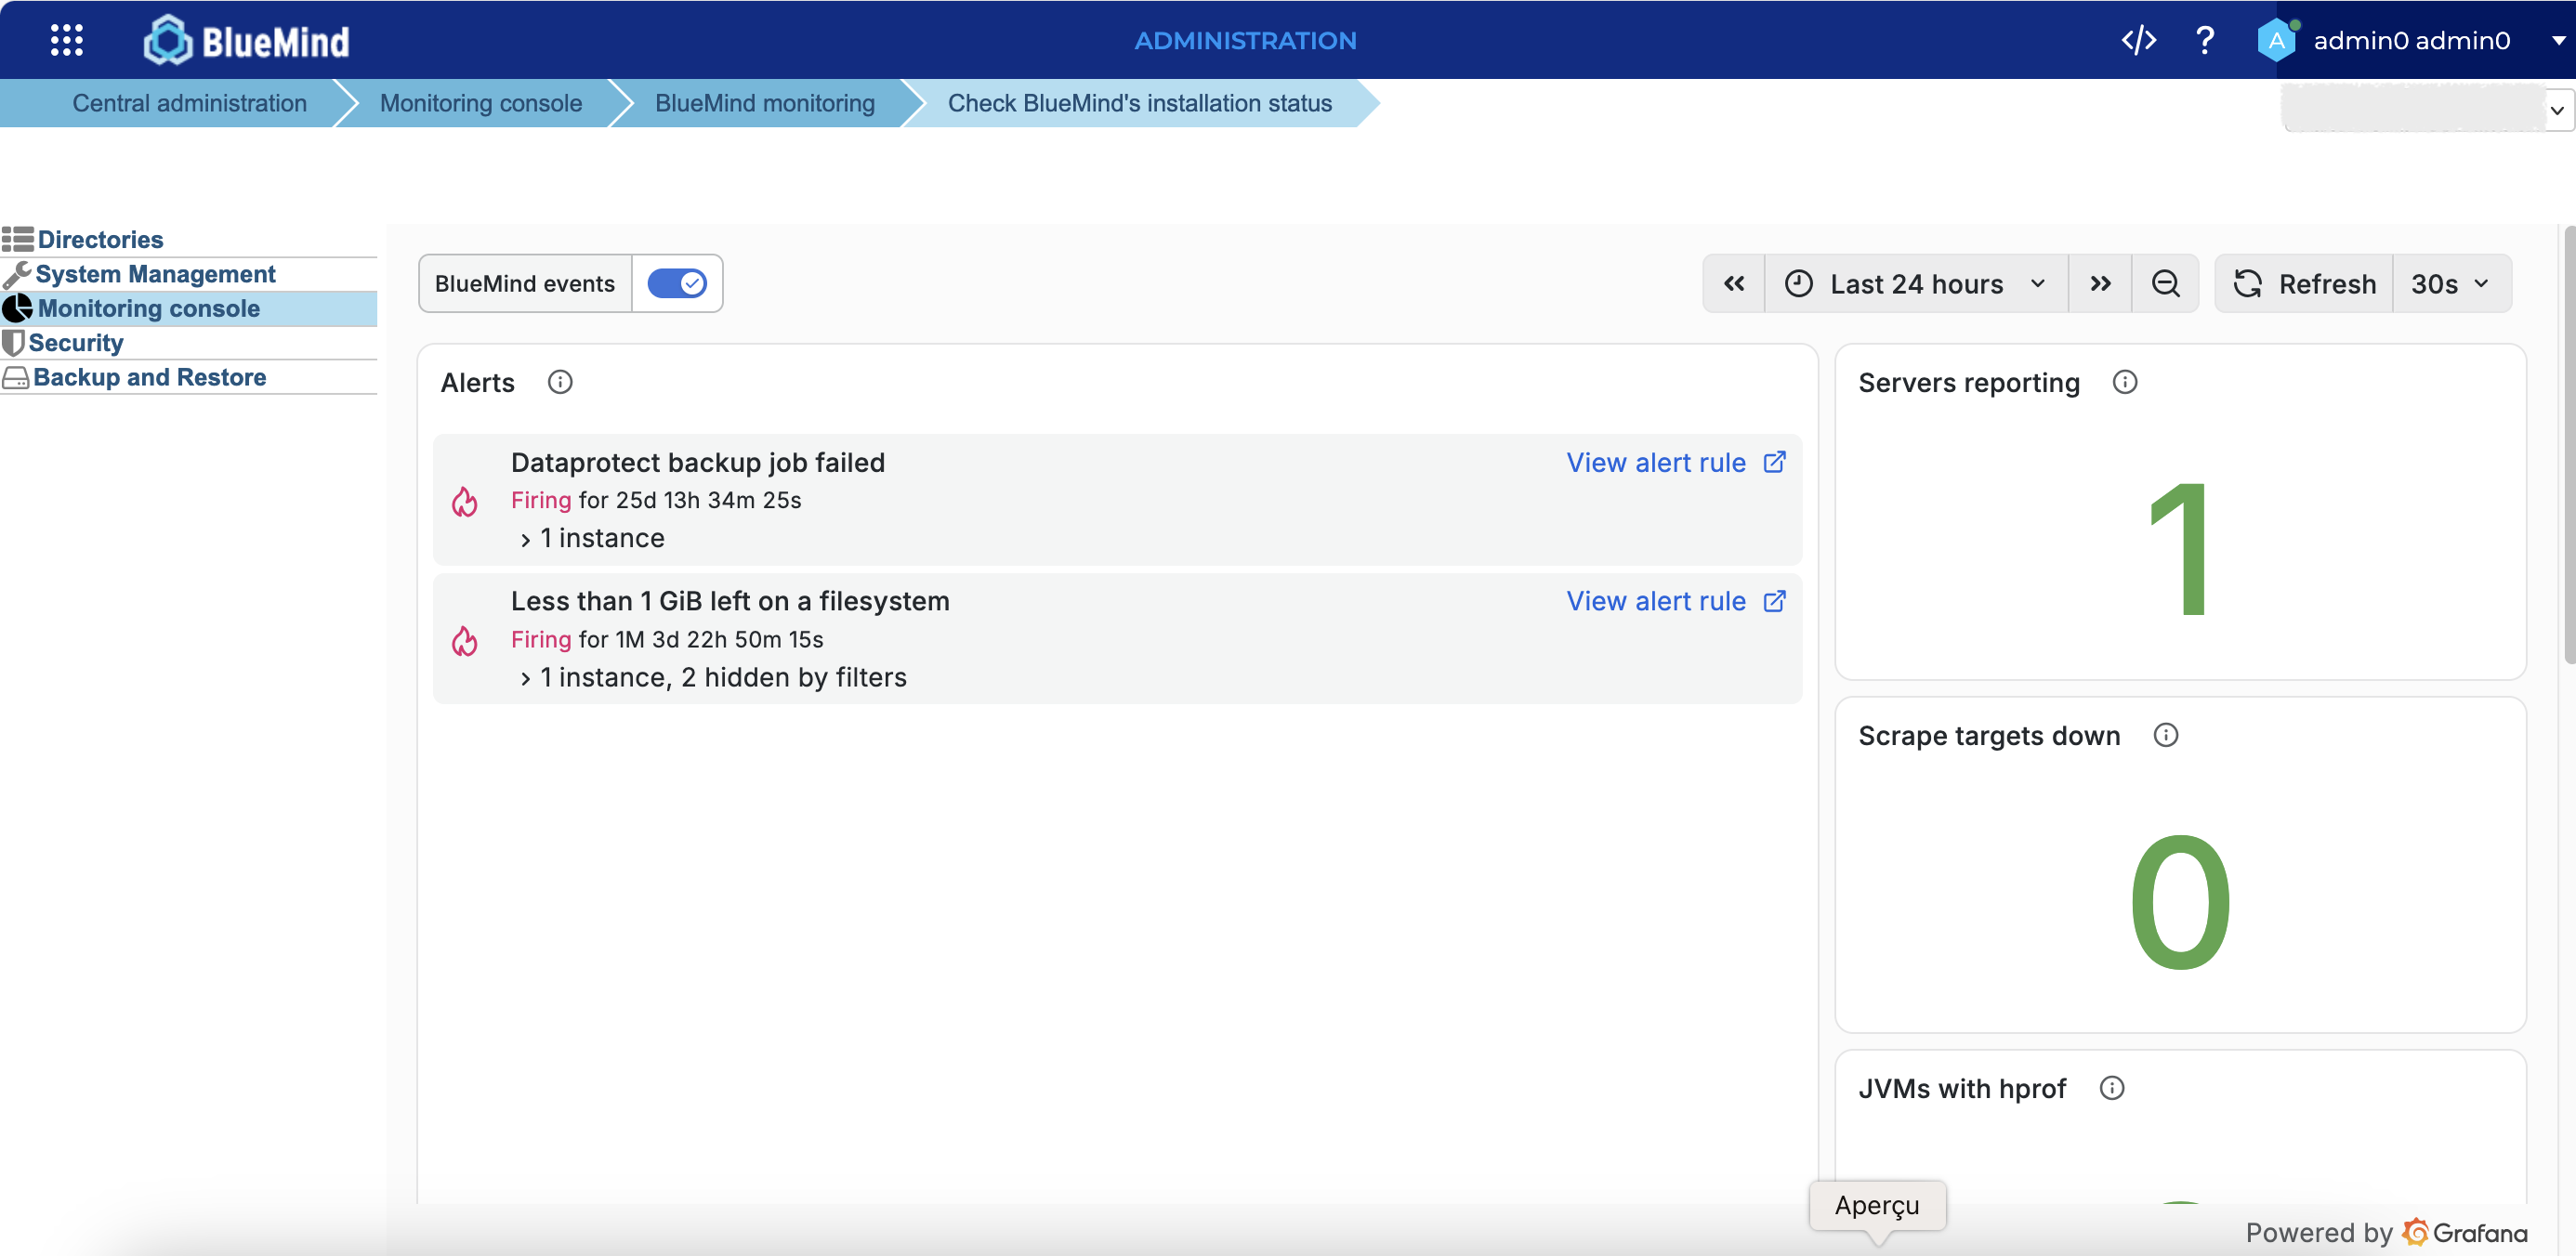
This alert is raised when the disks are full and the system can no longer write to the indexes.
Solution: add more disk space so that it disappears automatically.