Discovering the bm-tick monitoring tool
BlueMind uses the Tick monitoring tool to monitor all server data in real time as well as to view data history through its database-based storage. It also allows detailed alert configuration: in-UI alerts, command line actions, writing to a specific log file, etc.
The supervision tool is installed by default in BlueMind and must not be uninstalled.
The Tick package includes :
- Telegraf: the server agent for collecting & reporting metrics.
- InfluxDB: scalable database for metrics, events, and real-time analytics
- Chronograf: monitoring and visualization web user interface
- Kapacitor: framework for processing, monitoring, and alerting on time series data
In addition to these, the BlueMind package provides:
- BlueMind specific default configuration
- automatic configuration of Telegraf and installation of necessary plugins
- automatic configuration of dashboards and default alerts
The BlueMind package provides the most comprehensive, precise and customized monitoring possible for large amounts of data. You can also access data history, which is kept for one month and lets you view the data, monitor evolution and compare past data with existing data to detect and analyze issues.
Accessing bm-tick
The bm-tick supervision suite is automatically installed and configured in BlueMind.
You can access the application by logging on to the url https://<your bluemind>.tld/tick.
The username and password you are asked to enter are those provided to you by the installation wizard when you installed BlueMind, and can be configured in the BlueMind administration.
If you've lost your log in credentials, please refer to our FAQ on this issue: I have lost my password for the setup wizard
Accessing the application is more straightforward but requires a role to be assigned:
- Assign the role "Monitoring console" to the desired persons (For further information, see Roles: access and administration rights)
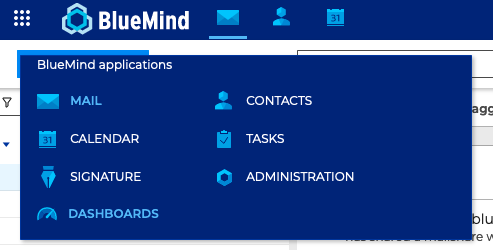
- Users now have a "Supervision" link in the banner (reconnection may be necessary) to access the console:
Discovering bm-tick interface
The homepage shows the key information:
- alert statistics
- alerts
- production information flow
- useful links
The DataExplorer tab lets you make queries to view and analyze the metrics collected.
The dashboards show real-time data graphs:
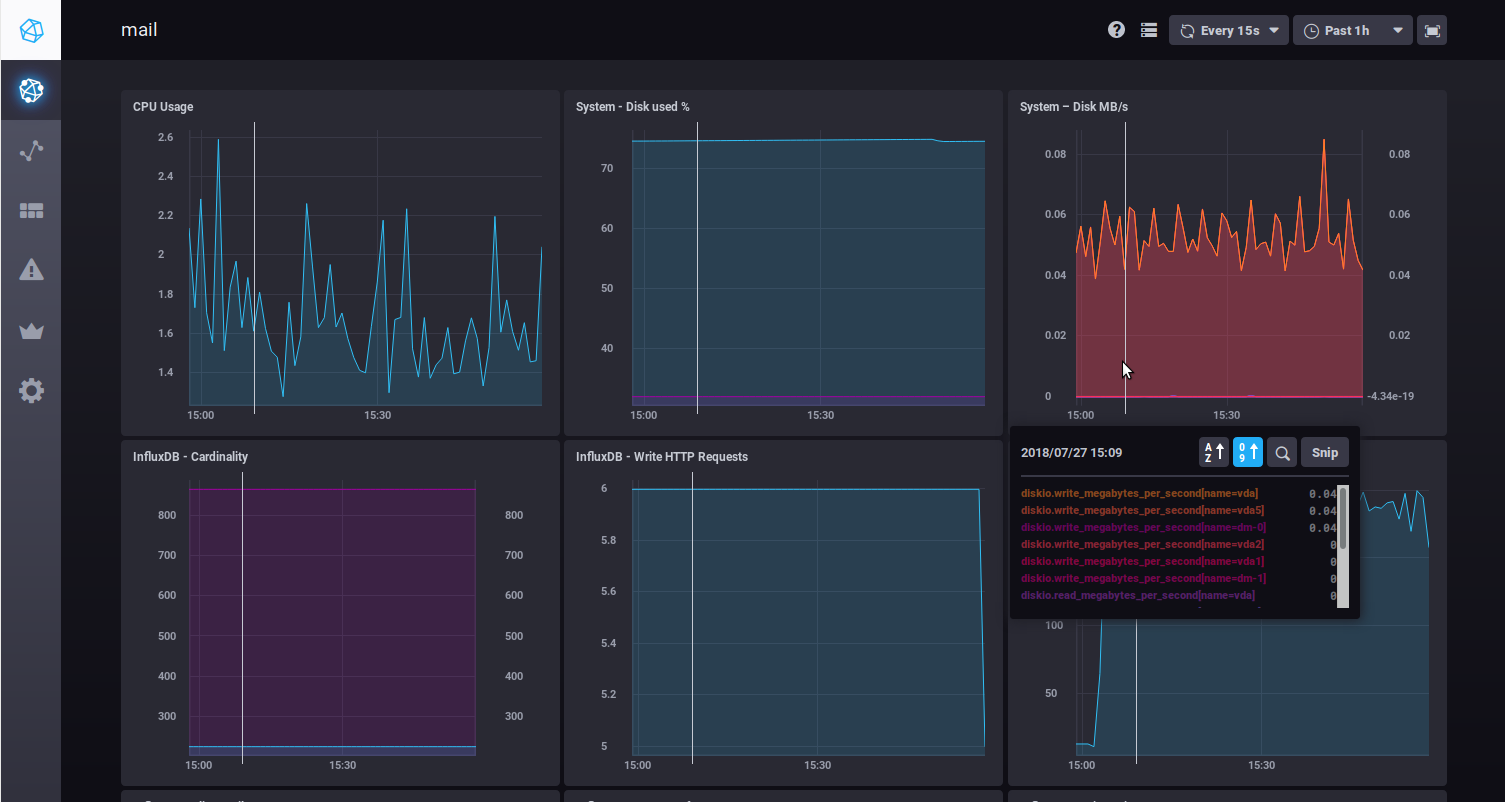
When you hover your mouse on a graph, detailed information on the data pointed at pops up. A white line also appears on the other graphs, showing the time the mouse is pointing at to help you read all the data for one point in time.
You can also zoom on a graph by selecting a time slot with your mouse. Double-clicking the selected time slot takes you back to the graph's default view.
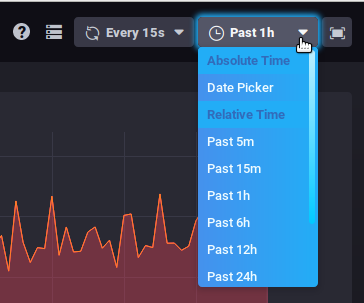
Two drop-down lists in the top right corner of each dashboard allow yo to change (or freeze) the refresh rate or the time frame to display:
This data is kept in memory when you switch between dashboards.
Find out more
Related BlueMind documentation pages
- Exploring and analyzing data with bm-tick
- Changing BlueMind server IP address
- Roles: access and administration rights